Occupational Interests & Gender Differences
With results like this, no wonder so many girls and women avoid STEM options (Science, Technology, Engineering and Mathematics)! Results from over 20,000 people show stark gender differences in work-related interests and preferences.
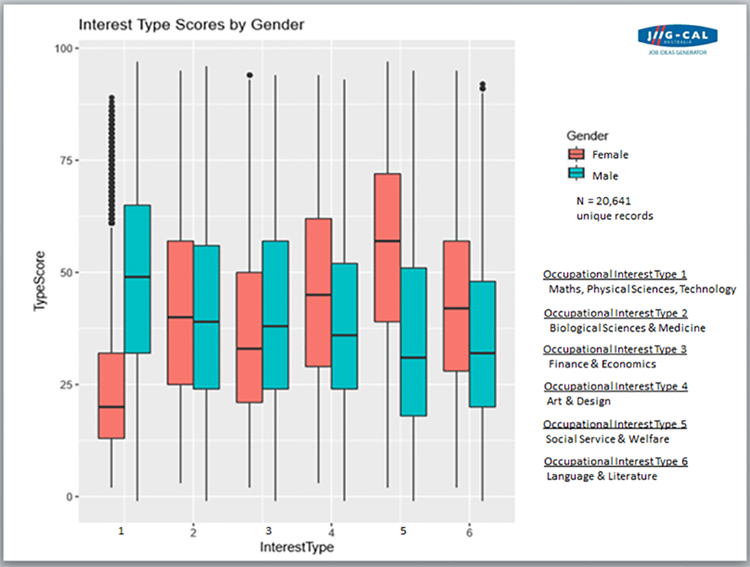
The chart below shows Occupational Interests across all age levels, broken down by gender. Interestingly, virtually the same pattern is in evidence at all ages, with only minor variations. This includes students in school year nine. Perhaps this explains a lot about later career choices.
The data is drawn from user results in the Occupational Interest components of Career Voyage (https://www.jiig-cal.com.au/careervoyage) and Career Compass (https://www.jiig-cal.com.au/careercompass). These components are arguably the most thoroughly researched, robust and accurate interest guides, based on millions of dollars-worth of research and development.
The analysis is based on a sample of 20,641 Australian users who accessed the Web based system between April and November 2016. The number of female participants was 11,212 (54%), and male participants 9,429 (46%).

* For further information about box charts & Interest Type definitions see notes below.
Occupational Interest Type 1 covers most of the STEM subject areas. As shown in the chart above the greatest gender difference is in this interest Type 1. The second greatest gender difference is seen in Interest Type 5, ie Social Service and Welfare with females having significantly higher levels of interest in this occupational area. In the four other interest Types the gender differences are smaller.
A break-down of the data by gender across different educational levels – from high school years 9 to 12, plus university, TAFE and beyond – is not included here as variations to the overall pattern are very small. Actually, very small indeed, which is surprising. While individual differences in interests vary as young people mature, these results show that overall patterns are stable and established before age fourteen.
Previous research established that the greatest stability across ages (ie as shown in test-retest correlations) occurs in the strongest liked and preferred occupational interest types. On the other hand, test-retest correlations are weakest amongst the least liked and preferred interest areas.
To make meaningful change for the future, investigation of relevant factors influencing young people (ie younger than 14 years of age) would seem more promising than “affirmative action” strategies aimed at older women and men.
Bob Bredemeyer
*NOTES
The box chart or plot is a standard way of summarising large amounts of data. The bottom of the box is set at the 25th percentile, the top is 75th percentile. The whiskers (vertical lines) from the boxes indicate variability outside the upper and lower quartiles, and any points outside those lines or whiskers are considered outliers. (Each small dot represents a single individual outlier.) The median is indicated with a horizontal line inside the box.
Definitions of the Occupational Interest Types are shown in the table below.
[su_table]Technology and science
| Art and design
|
Biological sciences and medicine
| Social service and health care
|
Finance and economics
| Language and Literature
|
